

Here’s a few videos on how to draw box plots, sometimes called box and whisker diagrams. They are fairly popular on GCSE mathematics although occasionally you’ll be asked to compare them with cumulative frequency diagrams. Both CF and box plots give the same time of information – median, upper / lower quartiles and range. questions where
Top Tips!
● Box plots are just another way of representing data
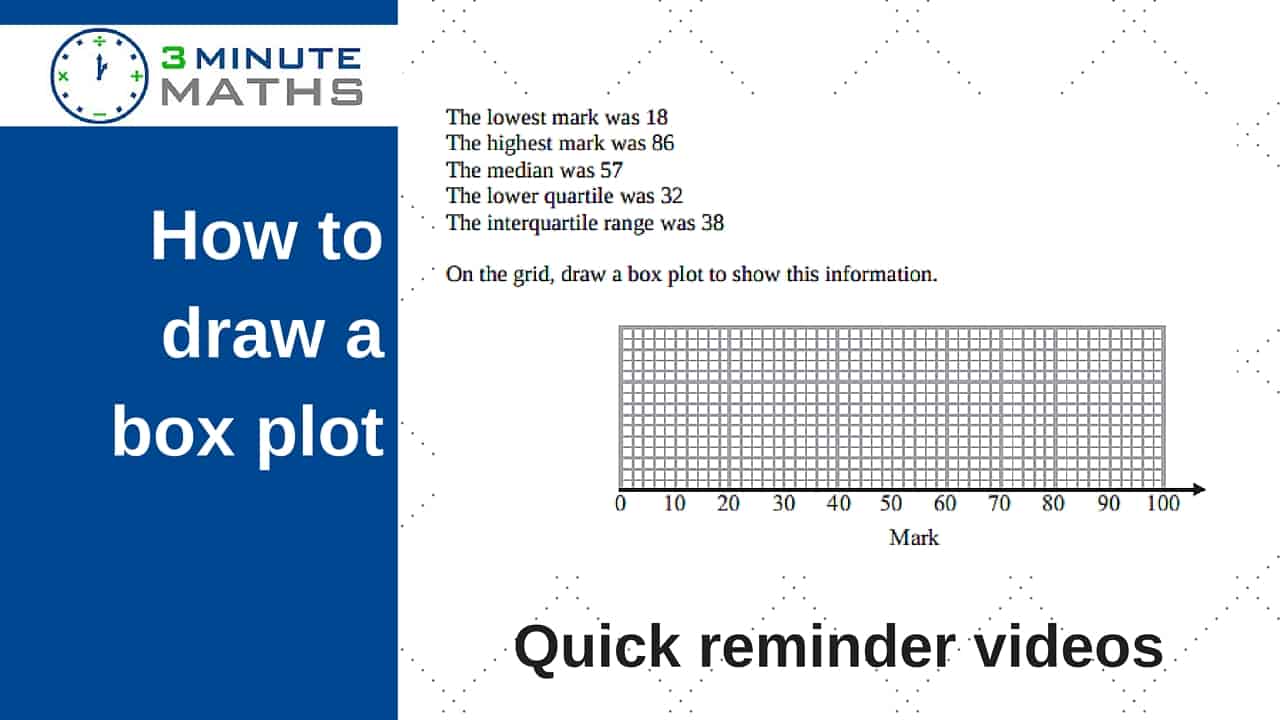
● The first ‘whisker’ is the lowest value, the top ‘whisker’ is the highest
● The median, lower and upper quartiles are the main box area
● Exam questions usually ask you to draw the box plot from the information in a table, or on a cumulative frequency diagram
● A common question is to ask for comparisons of box plots. The easiest way is to quote the median values, and make a comparison of the interquartile ranges you’ll usually find that one box plot is longer than the other (see videos for more information 🙂 )
If you’d like to ask for any more detail, or you’re not sure about anything, please do ask a question in the comments section.
All best with your studies


Watch on YouTube
How to compare box plots or box whisker diagrams – GCSE Level 4
How to draw a box plot or box and whisker diagram – GCSE level 4
HHow to draw a box plot or box and whisker diagram – line of numbers
[easyazon_image align=”none” height=”160″ identifier=”0748713891″ locale=”UK” src=”https://www.3minutemaths.co.uk/wp-content/uploads/2016/05/710M50SX46L.SL160.gif” tag=”matwra-21″ width=”127″]
[easyazon_image align=”none” height=”160″ identifier=”1841465453″ locale=”UK” src=”https://www.3minutemaths.co.uk/wp-content/uploads/2016/05/51RH7wHb8nL.SL160.jpg” tag=”matwra-21″ width=”113″]
[easyazon_image align=”none” height=”160″ identifier=”1841465364″ locale=”UK” src=”https://www.3minutemaths.co.uk/wp-content/uploads/2016/05/51qSWycadZL.SL160.jpg” tag=”matwra-21″ width=”113″]