

In this post we’re looking at a venn diagram. These types of questions tend to be fairly straightforward … or much more difficult … and, unfortunately, there isn’t anything in the middle ground. I must admit it took me a little while to understand these, and it’s only by constantly reading that I was able to work through the questions.
Download the worksheet here: Venn Diagram
A Venn diagram usually represents information and you need to be aware of a number of terms:
P – probability
∪ – union
∩ – intersection (usually called ‘and’)
as well as a ” ‘ ” sign that means ‘not.’


Watch on YouTube
Venn diagrams introduction ‘and’ & ‘union’ – GCSE maths
Venn diagrams introduction ‘not and’ & ‘not union’ – GCSE maths
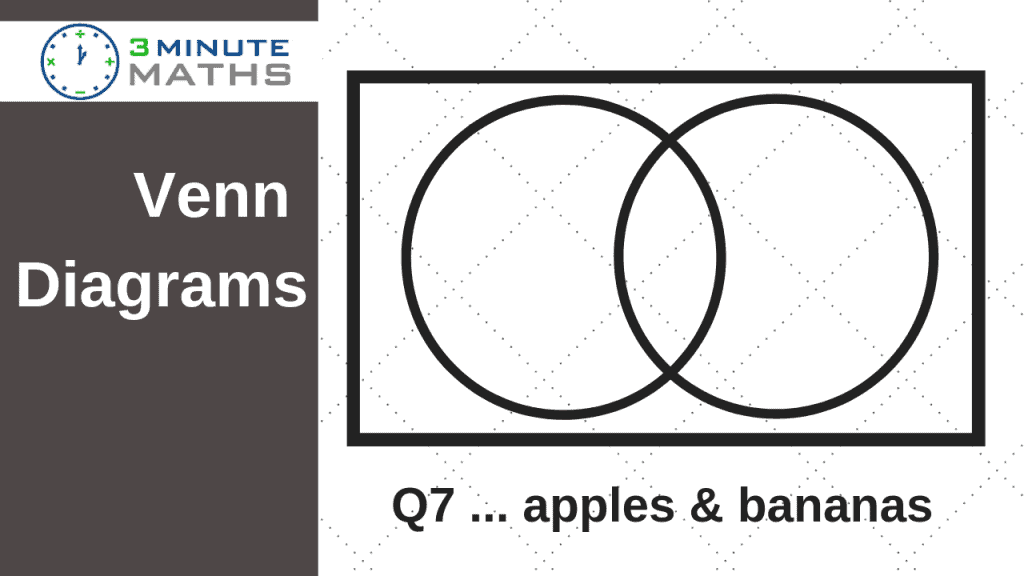
Venn diagrams apples & bananas question – GCSE maths level 7
Venn diagrams Q8 brothers and sisters – GCSE maths Grade 7
Venn diagrams Q9 France and Spain
Venn diagrams Q10 Tea Coffee Milk
I hope it becomes a little clearer as you work through the videos, and it might make sense to start with Q1-3, before moving on to the higher levels. They do take a bit of a leap forward, although should be OK if you have viewed the earlier ones.
Please do leave a comment below if you are not sure. Alternately you can view my YouTube channel and leave a comment there – I’ll always try to respond as quickly as possible.